Important Financial Ratios Every Investor Should Know - Part 2
There are many important factors and ratios that need to be focused while investing in any stocks.
And in this article we are going to learn about the some important ratios which are widely used to analyse the stocks
If you have not read Part -1 of this article then Click Here
- Earnings Per Share (EPS)
In Simple words, this ratio shows how much money earns a single share of a given company.
Now, let’s understand in detail. EPS shows the net income that a company’s common stock has generated over the past one year.
Please note that preferred shares are not included. Also, the number of common stock may and will change during the year. However, the official website of the company will give you very accurate and precise information.
EPS=Net income/Average Outstanding Shares
For example, a company has generated net earnings of Rs.10,000 and has 500 shares. Then the EPS is 20 (10000/500).
EPS=Net income/Average Outstanding Shares
For example, a company has generated net earnings of Rs.10,000 and has 500 shares. Then the EPS is 20 (10000/500).
- Dividend Yield
If a company has generated some profit, it distributes part of it to its shareholders in the form of dividends. If the board of directors decides to give Rs.10 per each share, and you have 10,000 shares, then you will receive a Rs. 1,00,000 as dividend.
People use this ratio to compare different stocks that pay a dividend.
The dividend yield is expressed as an annual percentage.
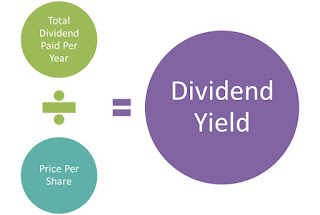
In order to calculate it, you need to know a company’s annual cash dividend per share as well as the current price of the stock. You have to take the dividend per share and divide it by the price per share.
Dividend Yield= Dividend Per Share/Price Per Share
For example, company ABC has annual dividend per share of Rs.10 and the price of this share is Rs.100. The result is (10/100), which means 10% Dividend Yield.
For example, company ABC has annual dividend per share of Rs.10 and the price of this share is Rs.100. The result is (10/100), which means 10% Dividend Yield.
- Debt-to-Equity Ratio (D/E Ratio)
This ratio shows the total debt of a company compared to its net worth. Therefore, you need to know two things when computing this ratio: total debt of the company and total shareholder equity. It will show the percentage of “leverage” a company has used. You can find the above-mentioned information on the balance sheet.
D/E Ratio = Total Debt/Total Shareholder Equity
The lower the ratio, the better. Investors should consider carefully companies with a D/E ratio above 50%.
The lower the ratio, the better. Investors should consider carefully companies with a D/E ratio above 50%.
- Current Ratio
This is another financial tool that proves how strong and sound financially a company is. If we have to be precise, this ratio assesses a company’s liquidity. In order to calculate this measure, you need to know two things. The first one is the company’s current assets, and the second is the company’s current liabilities.
Current Ratio = Current Assets/Current Liabilities
For instance, a company has Rs. 300 million in total current assets while its total liabilities are worth Rs. 100 million. The result is 3 (300 million/100 million), which is your Current Ratio.
The idea of using this tool is to make sure a company’s current assets would be able to pay off its debt. Most experts think that a ratio above 1 is a good sign – a company’s assets can pay off its liabilities. On the other hand, a Current Ratio below 1 might mean the company is not financially sound.
Will Cover more Financial ratios like above in upcoming articles


Comments
Post a Comment